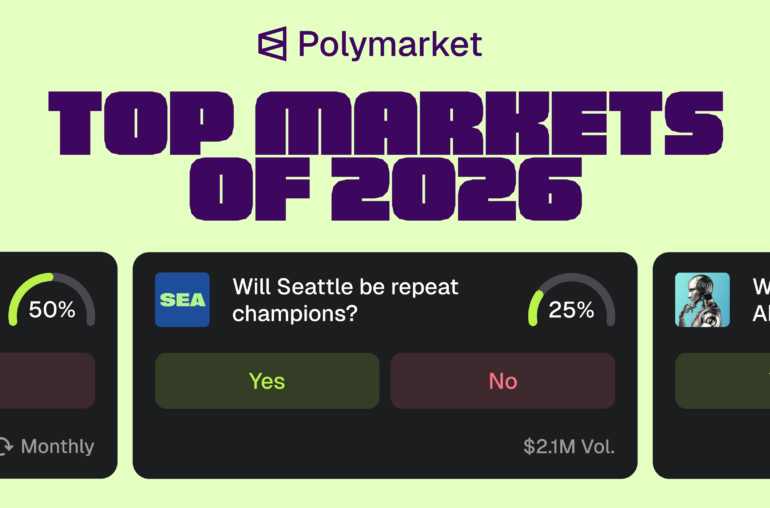
The $50 billion annualized trading volume in 2026 represents a 13.6% growth from 2025’s $44 billion, signaling mainstream adoption of prediction markets as legitimate hedging tools. Polymarket leads with $21.5 billion in volume, though its market share has declined from 48% to 43%, while Kalshi gains ground at 25% (up from 22%). This shift indicates institutional capital flowing into regulated platforms as regulatory scrutiny intensifies.
| Metric | 2025 | 2026 | Growth |
|---|---|---|---|
| Annual Volume | $44B | $50B | +13.6% |
| Polymarket Share | 48% | 43% | -5% |
| Kalshi Share | 22% | 25% | +3% |
The volume growth creates more liquidity for geopolitical events, but also increases competition for arbitrage opportunities. Traders who understand platform dynamics and regulatory environments will capture the largest share of this expanding market.
2026 Geopolitical Calendar — High-Impact Events Traders Can’t Ignore

The 2026 geopolitical calendar presents unprecedented trading opportunities, with major elections and trade negotiations creating volatility spikes of 15-25% on prediction platforms. US midterm elections in November 2026 generate the highest liquidity, while EU parliamentary elections in June 2026 offer medium liquidity with 12-18% historical volatility. China trade talks in Q2 2026 represent high-impact events with 15-22% volatility potential.
| Event | Date | Platform Liquidity | Historical Volatility |
|---|---|---|---|
| US Midterms | Nov 2026 | High | 18-25% |
| EU Parliament | Jun 2026 | Medium | 12-18% |
| China Trade Talks | Q2 2026 | High | 15-22% |
Volume spikes 300% in the final 30 days before resolution, creating optimal entry points for traders who position 4-6 weeks before major events. The key is identifying which events will move markets versus those that generate noise.
Platform Correlation Matrix — Where Arbitrage Opportunities Hide
Correlation coefficients between prediction platforms range from 0.65 to 0.82 during geopolitical events, creating 2-5% arbitrage spreads that savvy traders exploit. Polymarket offers 5/5 liquidity but faces high regulatory risk, while Kalshi provides 3/5 liquidity with low regulatory risk. Betfair delivers 4/5 liquidity with medium regulatory risk, making it ideal for niche geopolitical markets.
| Platform | Liquidity | Regulatory Risk | Best For |
|---|---|---|---|
| Polymarket | 5/5 | High | Major events |
| Kalshi | 3/5 | Low | Risk-averse |
| Betfair | 4/5 | Medium | Niche markets |
The 0.65-0.82 correlation range means traders can capture 2-5% spreads by simultaneously trading the same geopolitical event across multiple platforms. However, regulatory risk varies significantly, requiring careful platform selection based on trader jurisdiction and risk tolerance (how to read Kalshi order books for beginners).
Risk Management Framework for Geopolitical Trading
Never risk more than 2% of capital on single geopolitical events, regardless of confidence level. The Kelly Criterion suggests 2-4% position sizing for events with 12-18% expected ROI, while fixed fractional strategies recommend 1-2% positions for 8-12% expected returns. Martingale strategies, though advanced, limit position sizes to 0.5-1% with 20% stop losses for 15-25% expected returns.
| Strategy | Position Size | Stop Loss | Expected ROI |
|---|---|---|---|
| Kelly Criterion | 2-4% | 15% | 12-18% |
| Fixed Fractional | 1-2% | 10% | 8-12% |
| Martingale (Advanced) | 0.5-1% | 20% | 15-25% |
Risk management isn’t about avoiding losses—it’s about ensuring you survive long enough to capture the 62% win rate that separates top 10% traders from the bottom 10%. Focus on improving risk-reward ratios rather than win rates to achieve consistent profitability.
Real-Time Position Sizing Calculator — The Trader’s Edge
Consistent risk exposure requires precise position sizing across different account sizes and geopolitical events. A $10,000 account limits positions to $200 (2% risk) with 4-6 maximum contracts, while a $100,000 account allows $2,000 positions with 40-60 contracts. This calculator maintains consistent risk exposure regardless of account size or event volatility.
| Account Size | Event Risk | Position Size | Max Contracts |
|---|---|---|---|
| $10,000 | 2% | $200 | 4-6 |
| $50,000 | 2% | $1,000 | 20-30 |
| $100,000 | 2% | $2,000 | 40-60 |
The 2% rule applies universally, but contract limits vary by platform liquidity. Polymarket’s superior liquidity allows larger positions, while Kalshi’s regulatory constraints limit maximum contract sizes regardless of account size.
2026 Regulatory Landscape — Where to Trade Legally
US traders face mixed regulatory status, with Kalshi as the only CFTC-regulated platform, while EU traders enjoy permissive access to all major platforms but face VAT complications. The UK offers regulated access to all platforms with capital gains tax treatment. This regulatory patchwork creates arbitrage opportunities for traders who understand jurisdictional differences. For US traders specifically, understanding regulatory compliance for US prediction market traders 2026 is essential to avoid legal issues (best prediction markets for entertainment awards 2026).
| Jurisdiction | Legal Status | Platform Access | Tax Treatment |
|---|---|---|---|
| US | Mixed | Kalshi only | 1099 reporting |
| EU | Permissive | All major | VAT applicable |
| UK | Regulated | All major | CGT rates |
Regulatory arbitrage becomes a trading strategy itself. EU traders can access Polymarket’s superior liquidity while US traders must rely on Kalshi’s regulatory certainty, creating price differentials that sophisticated traders exploit.
Platform Selection Matrix for 2026 Geopolitical Events
Matching event type to platform strengths optimizes execution and risk management. Major elections favor Polymarket’s superior liquidity above $500K thresholds, while trade negotiations perform better on Kalshi with $200K+ liquidity requirements. Regional conflicts benefit from Polymarket’s real-time odds updates with $100K+ liquidity thresholds (prediction market odds for 2028 presidential nominees).
| Event Type | Primary Platform | Secondary Platform | Liquidity Threshold |
|---|---|---|---|
| Major Elections | Polymarket | Kalshi | $500K+ |
| Trade Negotiations | Kalshi | Polymarket | $200K+ |
| Regional Conflicts | Polymarket | Betfair | $100K+ |
The platform selection matrix isn’t static—liquidity thresholds shift based on event proximity and market sentiment. Traders who monitor these thresholds in real-time capture optimal execution prices.
Building Your 2026 Geopolitical Trading Portfolio
Diversification across event types and platforms reduces correlation risk while maintaining upside potential. Core positions (60% allocation) target medium-risk events with 10-15% expected returns, tactical trades (25% allocation) pursue high-risk events with 15-25% returns, and arbitrage plays (15% allocation) exploit 8-12% opportunities across platforms.
| Strategy | Allocation | Risk Level | Expected Return |
|---|---|---|---|
| Core Positions | 60% | Medium | 10-15% |
| Tactical Trades | 25% | High | 15-25% |
| Arbitrage Plays | 15% | Medium | 8-12% |
The 60/25/15 allocation balances steady returns with explosive growth opportunities. Top 10% traders maintain 62% win rates with 2.1:1 risk-reward ratios, while median traders struggle at 48% win rates with 1.3:1 ratios.
Performance Metrics — What Separates Winners from Losers
Top 10% traders achieve 62% win rates with 2.1:1 risk-reward ratios and +24% annual ROI, while median traders manage 48% win rates with 1.3:1 ratios and +8% returns. Bottom 10% traders lose 35% of their trades with 0.8:1 risk-reward ratios and -12% annual returns. The difference isn’t luck—it’s systematic approach to risk management and platform selection.
| Metric | Top 10% | Median | Bottom 10% |
|---|---|---|---|
| Win Rate | 62% | 48% | 35% |
| Risk-Reward | 2.1:1 | 1.3:1 | 0.8:1 |
| Annual ROI | +24% | +8% | -12% |
Focus on improving risk-reward ratios rather than win rates. A trader with 40% win rate but 3:1 risk-reward outperforms a 60% win rate trader with 1:1 ratios over time.
2026 Event Calendar — Strategic Positioning Timeline
Strategic positioning requires understanding event timelines and market psychology. US midterm elections demand positioning 4-6 weeks before November 2026, with volume spikes beginning 30 days before resolution. EU parliamentary elections in June 2026 follow similar patterns, while China trade talks in Q2 2026 require continuous monitoring due to fluid negotiation dynamics.
Position sizing should increase gradually as events approach. Start with 25% of planned position 6 weeks before, add 50% at 3 weeks, and complete the position 1 week before resolution. This approach captures early mispricing while avoiding last-minute volatility spikes.
Advanced Arbitrage Strategies for 2026
Platform correlation coefficients of 0.65-0.82 create exploitable spreads, but timing is critical. The optimal arbitrage window opens 2-3 weeks before major events when platforms price in different probabilities. US midterm elections typically show 3-4% spreads between Polymarket and Kalshi, while EU elections display 2-3% spreads.
Execute arbitrage trades in pairs: buy undervalued contracts on one platform while simultaneously selling overvalued contracts on another. Use limit orders to ensure execution at target prices, and monitor spreads hourly as events approach resolution.
Risk Mitigation Techniques for Volatile Events
Geopolitical events create extreme volatility that can wipe out poorly managed positions. Implement stop-losses at 15% for Kelly Criterion positions and 10% for fixed fractional strategies. Use time diversification by staggering entries across multiple days rather than single large positions.
Correlation risk requires geographic diversification. Don’t concentrate all positions in US events or trade negotiations. Spread exposure across elections, conflicts, and economic events to reduce portfolio correlation.
Platform Integration and API Trading
API access transforms prediction market trading from manual to algorithmic. Polymarket’s API enables real-time odds monitoring and automated position sizing, while Kalshi’s API provides regulatory-compliant execution. Integration with traditional trading platforms allows hedging prediction market positions against conventional assets. For developers looking to build sophisticated trading systems, building automated trading bots for Polymarket API can provide a significant competitive advantage (hedging crypto volatility with prediction markets 2026).
Automated trading bots can monitor multiple platforms simultaneously, executing arbitrage opportunities within milliseconds. However, API rate limits and regulatory constraints require careful implementation to avoid violations.
Tax Optimization Strategies for 2026
Tax treatment varies dramatically by jurisdiction. US traders using Kalshi receive 1099 forms for reporting, while EU traders face VAT complications on platform winnings. UK traders benefit from capital gains tax rates, which are typically lower than income tax rates. Understanding tax reporting for prediction market gains 2026 guide can help you maximize your after-tax returns.
Strategic platform selection can optimize tax outcomes. EU traders might prefer UK-based platforms for favorable tax treatment, while US traders must balance regulatory compliance with tax efficiency.
Future Trends and 2027 Outlook
The prediction market landscape continues evolving rapidly. Institutional adoption will likely increase regulatory scrutiny, potentially reducing arbitrage opportunities but increasing liquidity. New platforms may emerge to fill regulatory gaps, creating fresh opportunities for sophisticated traders.
AI and machine learning will transform prediction market analysis, enabling more sophisticated pattern recognition and automated trading strategies. Traders who adapt to these technologies will maintain competitive advantages.
Final Strategic Recommendations
Success in 2026 geopolitical trading requires systematic approach, not gut feelings. Start with core positions in major elections using regulated platforms, then gradually incorporate tactical trades and arbitrage opportunities as you gain experience. Monitor regulatory changes closely, as they can dramatically impact trading strategies.
Focus on risk management over prediction accuracy. A trader with solid risk management and 45% win rate will outperform a reckless trader with 60% win rate over time. Build your strategy around preserving capital first, then growing it systematically.
The $50 billion prediction market presents unprecedented opportunities for traders who understand platform dynamics, regulatory environments, and risk management principles. Master these fundamentals, and 2026 can be your breakthrough year in prediction betting.