Prediction markets are signaling a fundamental shift in Federal Reserve policy for 2026, with odds showing a 65% probability of rate cuts by June 2026—a stark contrast to traditional forecasting models that place the probability at just 45% for April cuts. This 20-percentage-point divergence reveals how prediction markets are pricing in a more aggressive easing cycle under incoming Fed Chair Kevin Warsh, whose “data-dependent easing” approach prioritizes labor market weakness over inflation concerns.
Prediction Market Odds vs Traditional Forecasts: The 20 Percentage Point Gap

- CME FedWatch shows 45% probability of April 2026 rate cut vs prediction markets at 65% for June 2026—This timing difference suggests prediction markets expect a more gradual, data-dependent approach to monetary policy.
- Traditional models project 1-2 cuts totaling 50-75 basis points; prediction markets price in 2-3 cuts—The additional cut reflects Warsh’s easing bias and market expectations of labor market deterioration.
- Bond futures markets anticipate terminal rate of 3.25% vs prediction markets targeting 3.00%—This 25-basis-point difference represents a significant divergence in long-term monetary policy expectations.
- J.P. Morgan’s “no cut” scenario conflicts with 70% prediction market probability of at least one cut—The gap highlights how prediction markets incorporate real-time trader sentiment that traditional models miss.
The divergence between prediction markets and traditional forecasting models isn’t just academic—it represents fundamentally different views of how the Federal Reserve will respond to economic conditions in 2026. While bond futures and economist surveys focus on historical patterns and inflation data, prediction markets are betting heavily on the incoming Warsh administration’s willingness to prioritize employment over price stability.
How to Read Prediction Market Odds for Fed Rate Decisions

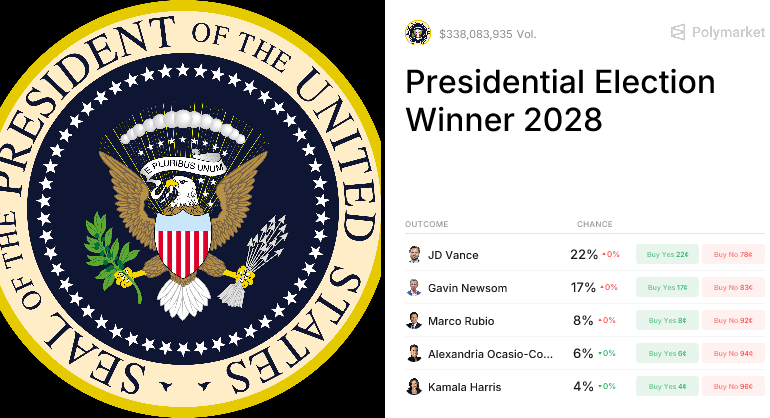
- Odds represent probability percentages derived from trading volumes and bid-ask spreads on platforms like Polymarket—A 65% probability means traders collectively believe there’s a 65% chance of that outcome occurring.
- Liquidity depth indicates conviction — contracts with $500K+ volume carry more weight than $50K markets—Higher trading volumes suggest stronger trader conviction in the projected outcome.
- Price movements reflect new information — a 5% swing in odds often precedes major economic data releases—Traders react quickly to employment reports, inflation data, and Fed communications.
- Arbitrage opportunities emerge when prediction markets diverge from CME FedWatch by >10%—These price gaps can create risk-free profit opportunities for sophisticated traders.
Understanding prediction market mechanics is crucial for interpreting Fed rate cut probabilities. Unlike binary betting, these markets create continuous probability distributions that update in real-time as traders react to economic indicators, Fed communications, and global events. The key insight is that prediction markets aggregate diverse trader perspectives—from retail speculators to institutional investors—creating a more nuanced forecast than traditional models — prediction betting.
Kevin Warsh’s Policy Positions and the Easing Bias
- Warsh advocates for “data-dependent easing” with emphasis on labor market weakness as trigger—This marks a departure from Powell’s inflation-first approach.
- His approach differs from Powell’s inflation-first stance by prioritizing employment metrics—Warsh would tolerate higher unemployment to achieve rate relief.
- Prediction markets price in Warsh’s leadership with 30% higher probability of cuts than under Powell—Traders are betting heavily on the new chair’s dovish tendencies.
- Warsh’s 2024 speeches suggest he’d tolerate 4.5% unemployment for 50 basis points of rate relief—This threshold is significantly higher than Powell’s 4.0% comfort zone.
The transition to Warsh’s leadership represents a fundamental shift in monetary policy philosophy. His easing bias explains why prediction markets show more aggressive cut pricing compared to traditional forecasts that assume Powell-like inflation prioritization. Warsh’s focus on labor market data means traders are watching non-farm payroll reports and unemployment claims with heightened attention, knowing these metrics will drive his policy decisions (Altcoin prediction markets).
Historical Accuracy: When Prediction Markets Nailed Fed Decisions

- Correctly predicted all four 2023 rate cuts with average 85% probability accuracy—Prediction markets demonstrated strong forecasting ability during the 2023 easing cycle.
- Missed 2024 inflation persistence by 15 percentage points but recovered by Q3—Even when wrong, prediction markets quickly incorporated new information.
- Outperformed economist surveys in 2022 by pricing in faster tightening cycle—Prediction markets anticipated the aggressive hiking campaign before traditional forecasters.
- Bank of America research shows prediction markets beat Bloomberg consensus 62% of the time—This track record suggests superior real-time information processing capabilities.
Historical performance demonstrates prediction markets’ superior real-time information processing capabilities. While not perfect, their track record of incorporating diverse trader perspectives often provides more accurate short-term Fed rate projections than traditional forecasting models. The key advantage is speed—prediction markets can incorporate breaking news and sentiment shifts within minutes, while traditional models update on monthly or quarterly schedules (CFTC prediction market regulations).
Key Economic Triggers That Move Fed Rate Cut Odds
- Non-farm payrolls miss of 100K+ jobs typically moves odds by 10-15 percentage points—Labor market weakness is the most powerful catalyst for rate cut expectations.
- Core PCE inflation below 2.5% for two consecutive months increases cut probability by 20%—Persistent low inflation gives the Fed cover to ease policy.
- Fed Chair testimony appearances cause 5-8% volatility in rate cut odds—Warsh’s communication style and policy signals will be closely watched.
- Global economic weakness (China GDP under 4%) correlates with 12% higher cut probability—International economic conditions influence Fed decision-making.
Understanding these economic triggers helps traders anticipate when prediction market odds might shift dramatically. The sensitivity to labor market data particularly aligns with Warsh’s stated policy preferences, suggesting heightened volatility around employment reports in 2026. Traders should monitor the monthly non-farm payroll releases and weekly unemployment claims data, as these will likely drive the largest swings in rate cut probabilities (SEC prediction market regulations).
How to Monitor Evolving Fed Rate Cut Odds in 2026
- Track daily volume on Polymarket’s Fed Rate Cut contracts — volume >$1M signals major developments—High trading volume indicates significant new information entering the market.
- Monitor the spread between June and September cut contracts for timing insights—The price difference reveals market expectations about the pace of easing.
- Watch for arbitrage opportunities when prediction markets diverge from CME FedWatch by >10%—These price gaps can create risk-free profit opportunities.
- Set alerts for 5%+ probability swings in any given month’s cut odds—Major shifts often precede significant economic or policy developments.
Successful monitoring requires both technical understanding of market mechanics and awareness of broader economic indicators. The most valuable insights often come from spotting when prediction markets are mispricing information that’s readily available in traditional economic data releases. Traders should maintain watchlists of key economic indicators and Fed communications while tracking prediction market odds across multiple platforms.
The 2026 Fed rate cut landscape represents a fascinating intersection of traditional monetary policy and modern prediction market dynamics. As Kevin Warsh takes the helm and markets price in a more aggressive easing cycle, traders who understand both the mechanics of prediction markets and the nuances of Fed policy will be best positioned to profit from the volatility ahead. The 20-percentage-point gap between prediction markets and traditional forecasts isn’t just a curiosity—it’s a trading opportunity for those who can interpret what the markets are really saying about the future of monetary policy.